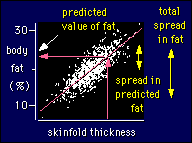
The SEE is another example of a root mean square error. This time we're fitting a line to the data, to make predictions. The SEE tells us something about the accuracy of the predictions.
|
A New View of Statistics | |
![]() Standard Error of the Estimate
(SEE)
Standard Error of the Estimate
(SEE)
The SEE is another example of a root mean square error.
This time we're fitting a line to the data,
to make predictions. The SEE tells us something about the accuracy of
the predictions.
 The figure shows an important
example: how to predict body fat from skinfold thickness. You measure
the skinfold thickness and body fat of several hundred subjects, then
draw the best straight line through the points. The SEE represents
the scatter of points about the line for any given value of skinfold
thickness, which means it's the "error"--actually a standard
deviation--in predicting body fat from a given value of skinfold
thickness. As drawn for these imaginary data, it's about 3%. Whenever
you measure the skinfold thickness on subjects in future and use the
straight line to predict their body fat, you will know that you could
be wrong by typically 3%.
Incidentally, the SEE--the scatter of body fat about the line for a given skinfold thickness--is assumed to be the same for every value of skinfold thickness. In other words, it doesn't matter where you are on the line, it's the same scatter in the vertical direction. I know it looks like there is less scatter at the ends of the line, but that's only because there are less points there. A hard one for newbies to understand!
Here's another important "incidentally". You can use a prediction
line only for subjects similar to (drawn from the same population as)
the subjects you used to make the prediction line in the first place.
A line based on active young female athletes is no good for
predicting body fat in sedentary middle-aged males. The SEE would
also be wrong.
Go to: Next · Previous · Contents · Search
· Home
resources=AT=sportsci.org · webmaster=AT=sportsci.org · Sportsci Homepage · Copyright
©1997
Last updated 29 April 97